The soil profile shifts dramatically between Shreveport’s Cross Lake area and the Red River floodplain. Downtown’s alluvial sands and clays sit above the Eocene-age Cockfield Formation, while neighborhoods near Caddo Heights encounter stiff clays that complicate seismic wave interpretation. Seismic tomography (refraction/reflection) cuts through that ambiguity by mapping shear-wave velocity (Vs) directly. It’s the difference between guessing at bedrock depth and seeing a continuous velocity profile. For site class determination under ASCE 7 Chapter 20, a MASW survey provides surface-wave dispersion, but when you need deeper resolution or cross-hole detail, seismic tomography delivers the full picture. Contractors and structural engineers across Shreveport rely on this method to plan excavations and foundation loads in a city where the water table often sits just 15 feet below the surface.
A high-resolution Vs profile removes the guesswork from site class assignment, especially where paleochannel sands lurk beneath Shreveport’s stiff surface clays.
Process and scope
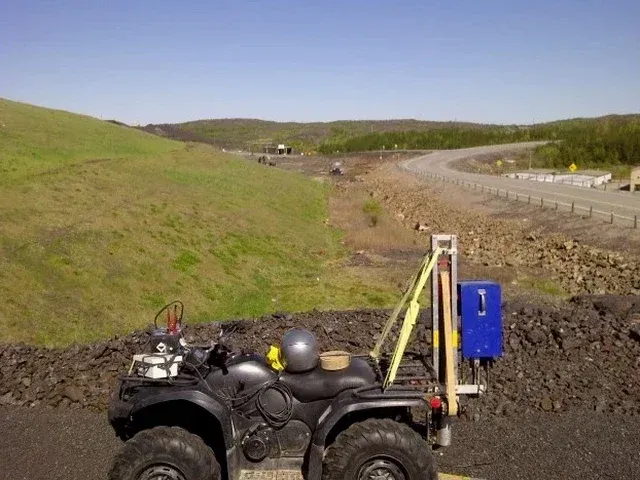
Site-specific factors
In Shreveport, we often see site plans that assume uniform stratigraphy across a parcel that straddles an old Red River meander. Seismic tomography exposes the buried channel—a low-velocity lens of loose sand that conventional borings might miss if spaced too wide. That lens is a liquefaction trigger under the design earthquake. Another risk pattern is misidentifying the top of the Cockfield Formation. Weathered Cockfield can look like dense clay in a split-spoon sample but carries seismic velocities 30–40% lower than competent rock. If an engineer bases pile tip elevation on refusal depth alone, they’re in trouble. Seismic reflection resolves that transition plainly. For deep excavations near the riverfront, the velocity model also feeds into dewatering design: saturated sand zones below the water table show up as sharp P-wave velocity drops.
Standards used
ASCE/SEI 7-22 Minimum Design Loads and Associated Criteria for Buildings and Other Structures (Chapter 20 – Site Classification Procedure), IBC 2024 (referencing ASCE 7 for seismic site class determination), ASTM D5777-18 Standard Guide for Using the Seismic Refraction Method for Subsurface Investigation, ASTM D7128-18 Standard Guide for Using the Seismic Reflection Method for Shallow Subsurface Investigation, ASTM D7400-19 Standard Test Methods for Downhole Seismic Testing
Complementary services
Seismic Refraction Tomography
P-wave and S-wave refraction profiling for bedrock depth, rippability assessment, and Vs30. Ideal for sites under 150 feet of investigation depth. We use hammer and weight drop sources; every shot gets a reverse hit for reciprocal time QC.
Seismic Reflection Profiling
High-resolution 2D reflection lines for fault detection, deep stratigraphic mapping, and paleochannel delineation. Common-offset or CDP gathers processed with pre-stack time migration where the geology demands it.
Vs30 & Site Classification
ASCE 7-22 site class computation from direct S-wave velocity measurement. Report includes Vs30, N-value correlation where available, and the site class letter for the structural design package.
Combined Tomography & CPT Correlations
Parallel seismic lines and cone penetration tests tied to velocity boundaries. This correlation tightens the soil profile interpretation and supports liquefaction triggering analysis in Shreveport’s alluvial deposits.
Typical parameters
FAQ
What does a seismic tomography survey cost in Shreveport?
Typical budgets run from US$2,750 to US$5,310 depending on line length, depth target, and whether the job requires just refraction or both refraction and reflection. Multiple lines, restricted access, or dense vegetation push costs toward the upper end.
How does seismic tomography determine site class for ASCE 7?
The survey measures shear-wave velocity directly in the top 100 feet. We compute Vs30 from the S-wave model and assign site class A (hard rock) through E (soft soil) per ASCE 7-22 Table 20.3-1. This replaces the default N-value correlation method with a measured velocity profile.
Can seismic reflection map faults in the Shreveport area?
Yes. High-resolution 2D reflection can image offsets in the Cockfield and Sparta formations. The technique works best where velocity contrasts exist across the fault plane. We design line orientation perpendicular to the expected strike and use CDP stacking to suppress shallow noise common near the Red River corridor.