Contractors working the bluffs near Cross Lake or the Red River often assume a 2:1 cut is always stable. That assumption fails here. Shreveport’s geology is a layered puzzle of Pleistocene terrace deposits, stiff clays, and loose sands that can unravel fast after heavy rain. A proper slope stability analysis maps the failure surface before you move dirt. We run limit equilibrium models using real shear strength data from undisturbed samples. No generic parameters. No guesswork. When a slope fails, the repair cost dwarfs the price of a triaxial test or a CPT sounding done early in design. We deliver the factor of safety the city requires under IBC Chapter 18 and ASCE 7 load combinations.
A slope’s factor of safety can drop from 1.5 to 0.9 in one wet season if pore pressures aren’t modeled correctly.
Process and scope
We also cross-check slope geometry with Atterberg limits data; high plasticity index clays in the Wilcox Formation are notorious for swelling and progressive strength loss at the toe of a cut.
Site-specific factors
Shreveport’s expansion east and south from the Red River floodplain pushed development onto older, dissected uplands. Streets like Ellerbe Road and neighborhoods near Fern Avenue cross subtle drainage divides where cuts deeper than ten feet expose preconsolidated clay with relic slickensides. These old shear surfaces have near-residual strength. A slope stability analysis that misses them overestimates the factor of safety. We’ve seen designs that penciled out at FoS 1.4 drop below 1.0 when residual friction angles from the Wilcox clay were plugged in. The other big risk is construction-phase loading: stockpiling fill at the top of a cut, or undercutting the toe for a utility trench, triggers failures that have no warning signs. Scour along the Red River banks adds a fluvial erosion component that our analyses address with toe protection and benching recommendations.
Standards used
IBC 2021 Chapter 18 (Soils and Foundations), ASCE 7-22 Section 11.8 (Seismic Stability of Slopes), ASTM D1586 (Standard Penetration Test), ASTM D4767 (Consolidated Undrained Triaxial), USACE EM 1110-2-1902 (Slope Stability), FHWA NHI-06-088 (Soil Slope and Embankment Design)
Complementary services
Stabilization Design
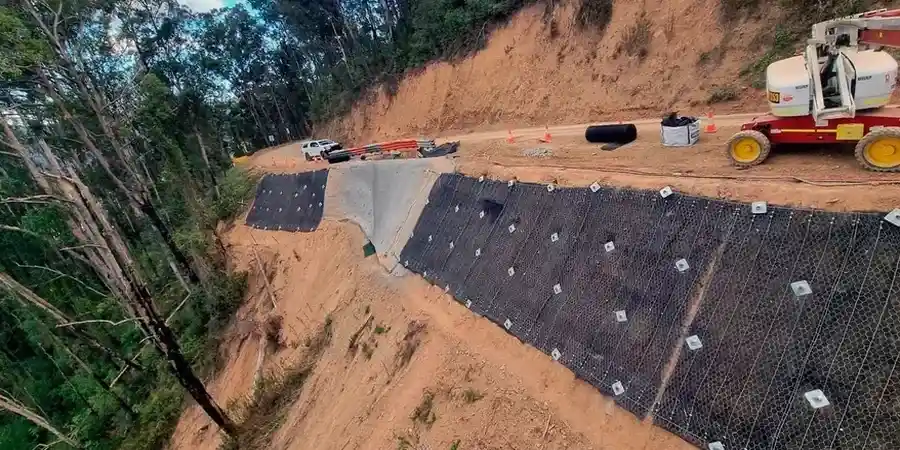
We specify soil nails, tieback anchors, or reinforced earth berms sized to achieve the target FoS. Outputs include nail spacing, bond length, and facing details ready for the contractor.
Construction Monitoring
We install slope inclinometers and piezometers during cut operations. Weekly readings detect movement before it’s visible. Data goes directly to the superintendent and the engineer of record.
Forensic Investigation
If a slope has already moved, we map the scarp, log borings through the failure plane, and run back-analysis to determine the strength mobilized at failure. This yields the true residual shear strength for the remediation design.
Typical parameters
FAQ
How much does a slope stability analysis cost in Shreveport?
Fieldwork and modeling typically range from US$1,110 for a small single-family lot cut to US$4,440 for a commercial embankment or subdivision slope with multiple cross-sections. The final figure depends on number of borings, lab shear tests required, and complexity of the groundwater model.
What’s the difference between a global and a local factor of safety?
A global factor of safety assumes the entire soil mass fails along one continuous surface. A local factor of safety checks each slice in a method like Spencer’s or Morgenstern-Price’s for interslice force acceptability. We report both. Local checks catch thin weak seams that global analysis can average out.
Do I need a slope stability analysis for a cut under 10 feet deep?
Not always by code, but in Shreveport’s high-plasticity Wilcox clays, we recommend it. Shallow sloughing failures are common at 6-8 foot depths after prolonged rain. The analysis pays for itself when it prevents a surficial slide that takes out a property line or a retaining wall footing.
How long does the analysis take from start to finish?
Fieldwork and lab testing take 5-7 business days. Modeling and report run 3-5 business days after lab data is in. Rush turnaround is available if the contractor is waiting on a permit—we can mobilize a crew and deliver preliminary results in 5 working days total.